


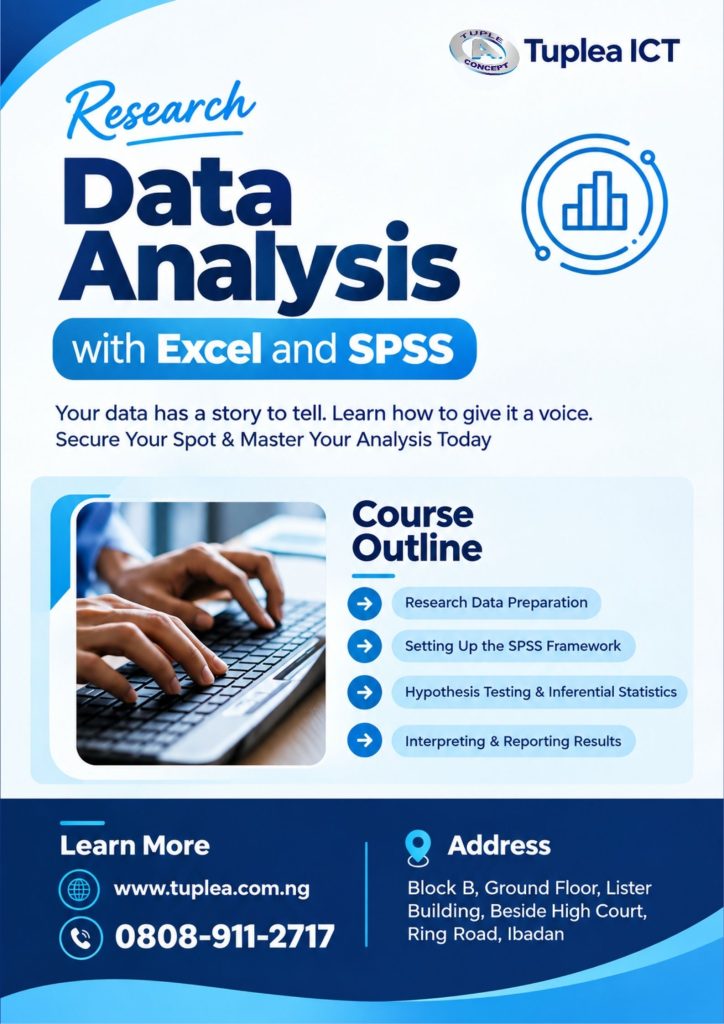
Master data preparation, hypothesis testing, inferential statistics and research reporting with practical training from Tuplea ICT.
Collecting data is only one part of research.
You may have spent weeks designing questionnaires, conducting surveys, interviewing respondents and gathering information. You may now have hundreds or even thousands of responses sitting in an Excel spreadsheet.
But there is one important question:
What does the data actually mean?
This is where research data analysis comes in.
At Tuplea ICT, we are introducing our Research Data Analysis with Excel and SPSS training to help students, researchers and professionals move beyond simply collecting data and learn how to prepare, analyse, interpret and present their findings with confidence.
Why Data Analysis Matters in Research
Good research is not just about collecting a lot of information. The real value comes from being able to turn that information into meaningful findings.
Imagine completing your research questionnaire and receiving 300 responses.
You open the spreadsheet and see columns filled with numbers, categories and responses.
You might start asking:
- How do I clean this data?
- How do I organise my variables?
- Which statistical test should I use?
- How do I test my hypothesis?
- What does my SPSS output actually mean?
- How do I interpret the tables?
- How do I present my findings in my project or thesis?
- How do I know whether my results are statistically significant?
These are common challenges faced by students and researchers.
Learning data analysis gives you the skills to answer those questions.
Learn Research Data Analysis with Excel and SPSS
Our training focuses on the practical side of research data analysis.
Rather than simply showing you where to click in a software package, the goal is to help you understand what you are doing, why you are doing it and how to interpret the results.
1. Research Data Preparation
Before analysis begins, your data needs to be properly organised.
You will learn the fundamentals of preparing research data for analysis, including organising variables, structuring datasets and getting your data ready for statistical analysis.
2. Setting Up the SPSS Framework
SPSS is widely used for statistical analysis in academic research and other research-related projects.
You will learn how to structure your dataset in SPSS and work with variables and data in a way that supports your research objectives.
3. Hypothesis Testing & Inferential Statistics
Research often requires more than describing what your respondents said.
You may need to determine whether relationships, differences or patterns observed in your sample are statistically significant.
The training introduces you to hypothesis testing and inferential statistics, helping you understand the reasoning behind statistical analysis.
4. Data Analysis with Excel
Excel is more than a spreadsheet for entering numbers.
With the right skills, it can be used to organise, clean, summarise and explore data.
You will learn practical approaches to working with research data in Excel and preparing information for meaningful analysis.
5. Interpreting & Reporting Results
Running an analysis is not the end of the process.
One of the most important research skills is being able to understand what your results mean and communicate them clearly.
You will learn how to interpret your analytical results and present findings in a way that supports your research objectives.
Who Is This Training For?
This course is suitable for people who work with research data and want to develop practical data analysis skills.
It can be particularly useful for:
- Final-year university students working on research projects
- Postgraduate students working on dissertations and theses
- Researchers conducting surveys and quantitative research
- Academics and research assistants
- Professionals who need to analyse research or survey data
- Anyone who wants to become more confident using Excel and SPSS for data analysis
You don’t need to be a statistics expert to begin.
The training is designed to help you understand the process progressively and apply what you learn to practical research situations.
From Raw Data to Research Findings
Think about your research journey.
You start with a question.
You collect responses.
You organise your data.
Then comes the part that can determine how useful your research becomes: analysis.
Your spreadsheet contains the raw information.
Your analysis helps you discover the patterns.
Your interpretation gives those patterns meaning.
And your report communicates the findings.
That is why learning data analysis is not simply about learning software.
It is about learning how to make sense of evidence.
Don’t Just Have Data. Understand It.

Many researchers become frustrated when they reach the analysis stage of their project.
They have done the hard work of collecting responses, but they are unsure about what comes next.
If that sounds familiar, this training can help you build the practical foundation you need.
You will learn how to approach your dataset systematically, use Excel and SPSS effectively, understand statistical results and communicate your findings more confidently.
Your data has a story to tell.
The question is:
Do you know how to tell it?
Join the Research Data Analysis Training
Take the next step towards becoming more confident with research data.
What you’ll gain
✓ Practical data analysis skills
✓ Excel and SPSS experience
✓ Understanding of hypothesis testing
✓ Exposure to inferential statistics
✓ Research data preparation skills
✓ Better understanding of statistical outputs
✓ Research reporting and interpretation skills
Physical and online learning options are available.
Register with Tuplea ICT
📞 Call/WhatsApp: 0808 911 2717
🌐 Website:www.tuplea.com.ng
📍 Training Venue:
Block B, Ground Floor, Lister Building, Beside High Court, Ring Road, Ibadan, Oyo State.
Limited spaces available for the next cohort.